3.5.1.4 Heat Map
You can Search and Export Heat Map results.
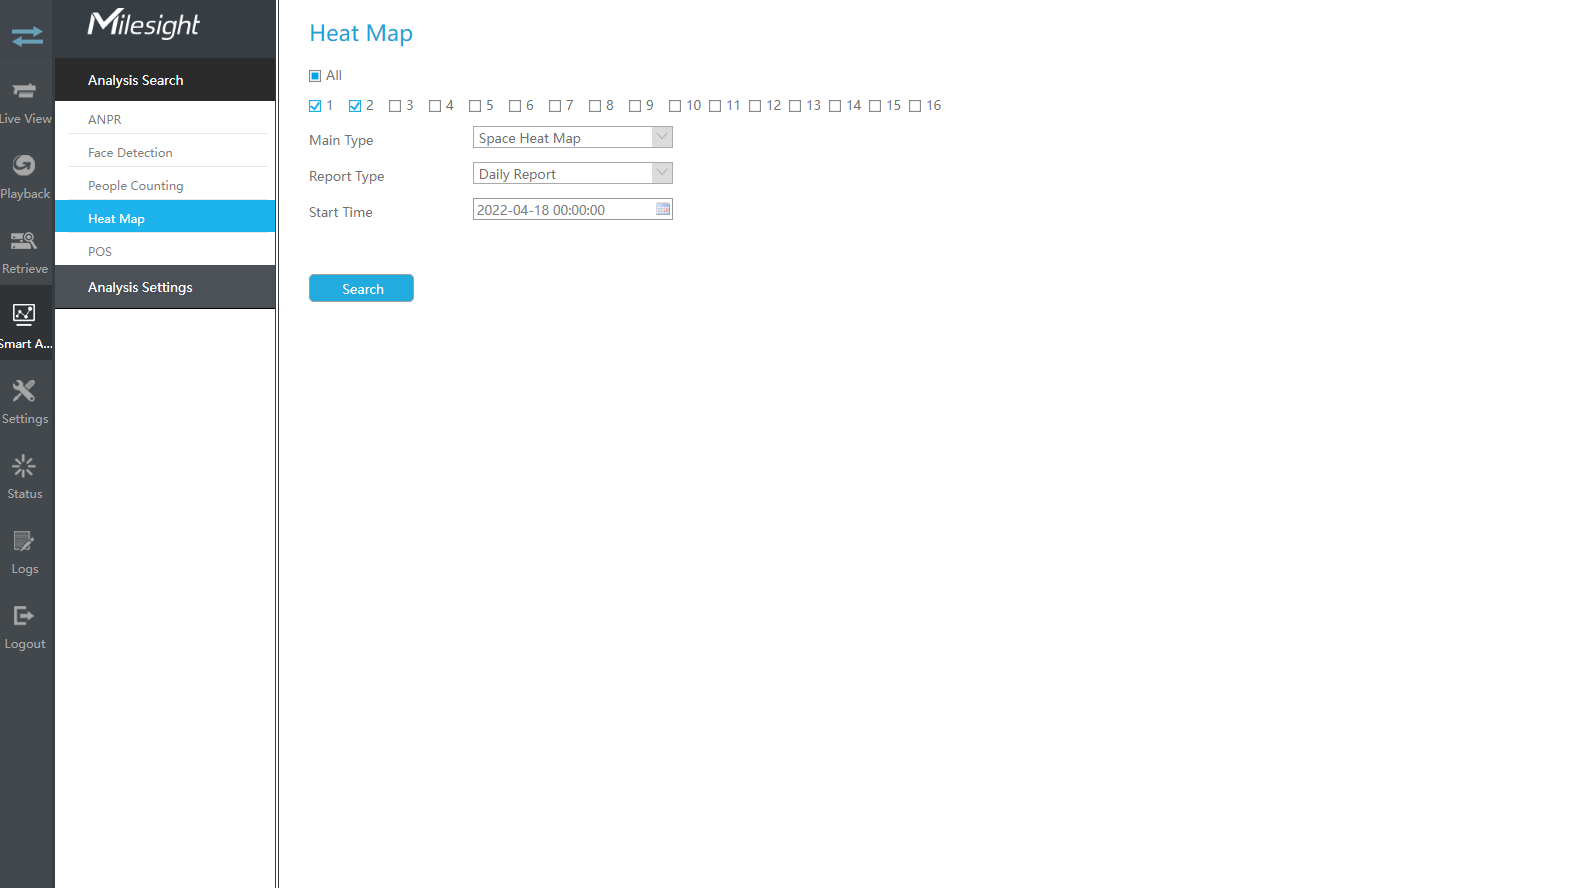
Step1: Entering search conditions.
Step2: Check the corresponding channels. It supports simultaneous search of multi-channel reports.
Step3: Select the Main Type. Space Heat Map and Time Heat Map are available.
(1) Space Heat Map: Space Heat Map will be presented as a picture with different colors. Different colors represent different heat values. Red represents the highest and blue represents the lowest.

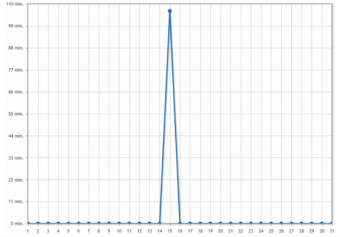
(2) Time Heat Map: Time heat map will be presented as a line chart to show the heat at different times.
Step4: Select the Report Type. Daily Report, Weekly Report, Monthly Report and Annual Report are available.
Step5:Input the time from which you want to Search.
Step6: Click ![]() to obtain the corresponding result and then you
can click
to obtain the corresponding result and then you
can click ![]() to export
it.
to export
it.